Node view
disk
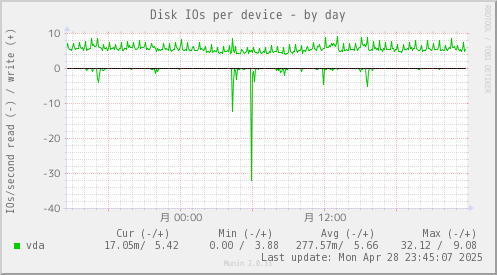
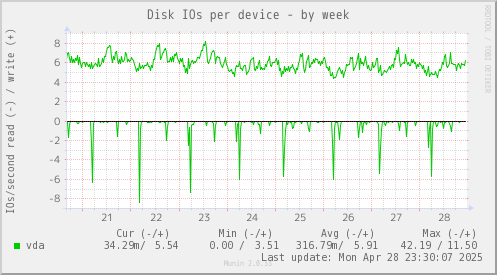
| Disk IOs per device | |
|
|
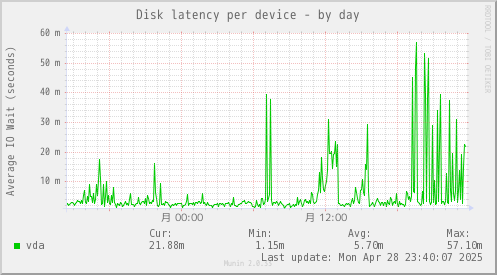
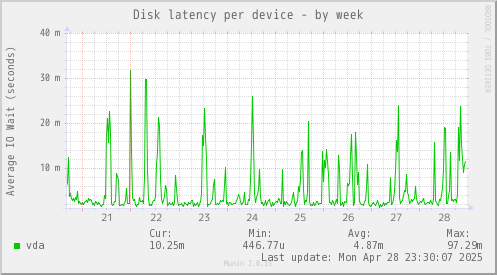
| Disk latency per device | |
|
|
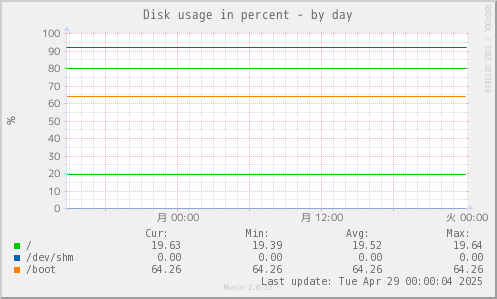
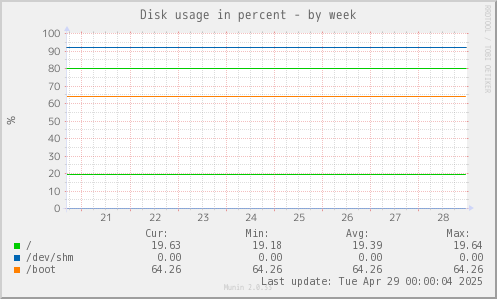
| Disk usage in percent | |
|
|
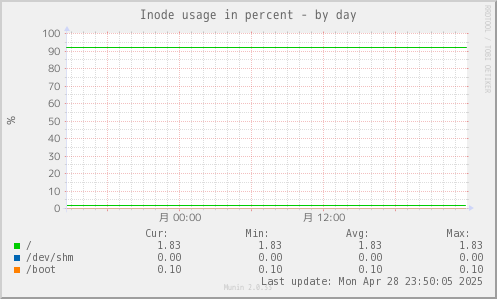
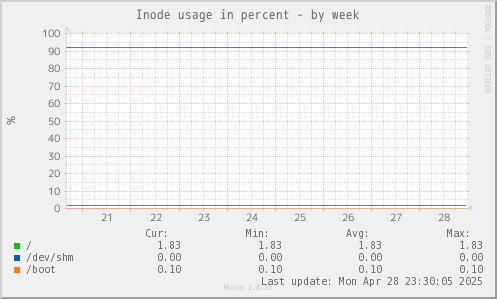
| Inode usage in percent | |
|
|
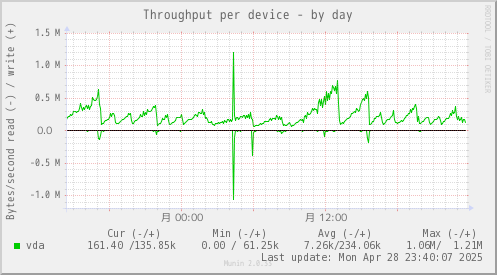
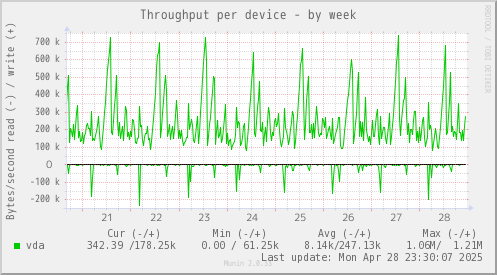
| Throughput per device | |
|
|
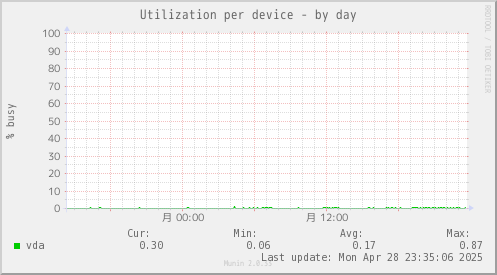
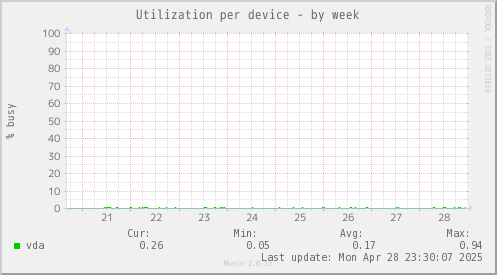
| Utilization per device | |
|
|
elasticsearch
| ElasticSearch cache | |
|
|
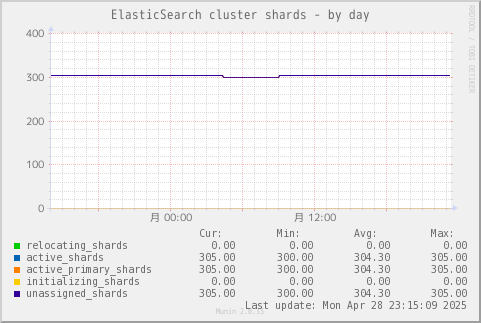
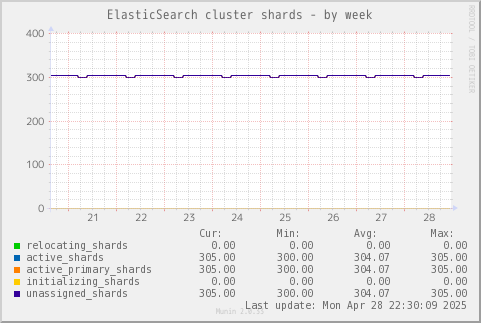
| ElasticSearch cluster shards | |
|
|
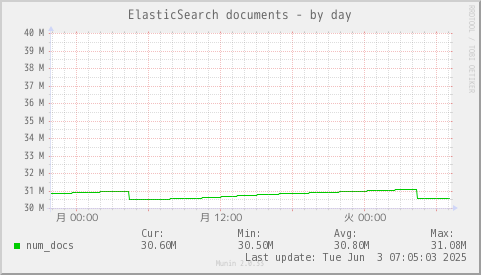
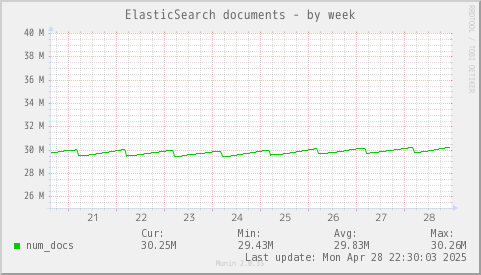
| ElasticSearch documents | |
|
|
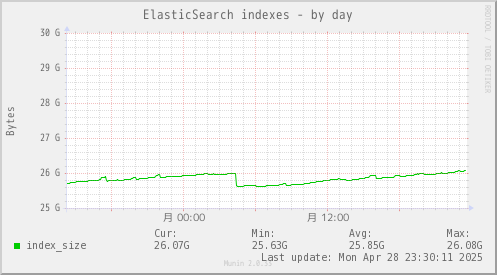
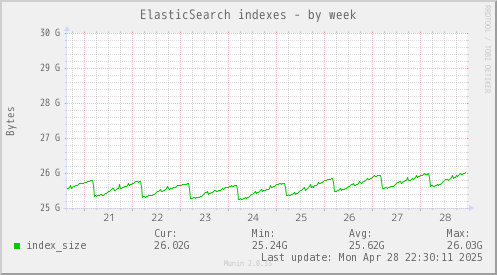
| ElasticSearch indexes | |
|
|
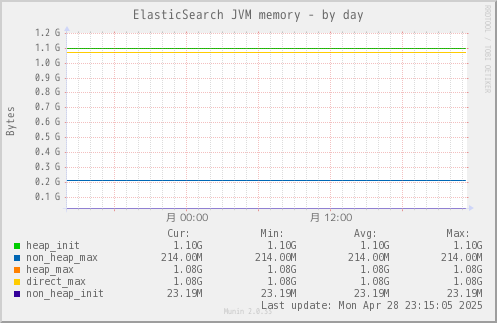
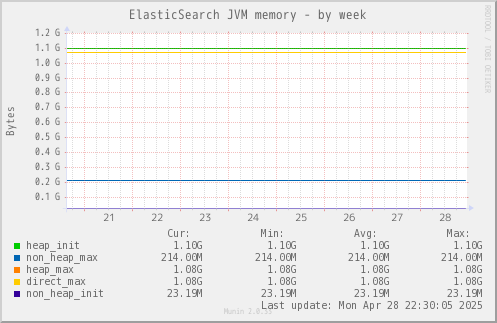
| ElasticSearch JVM memory | |
|
|
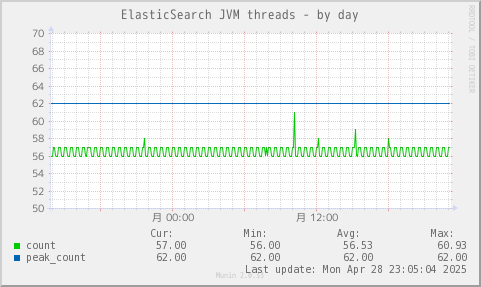
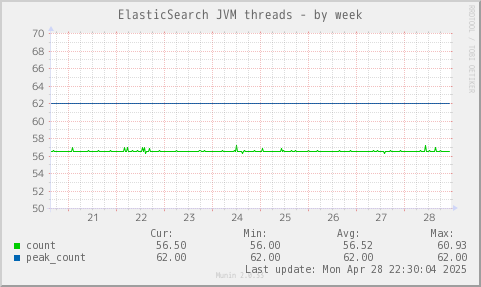
| ElasticSearch JVM threads | |
|
|
network
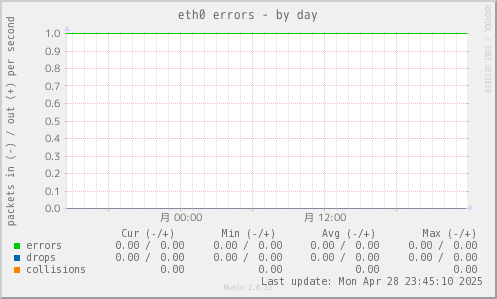
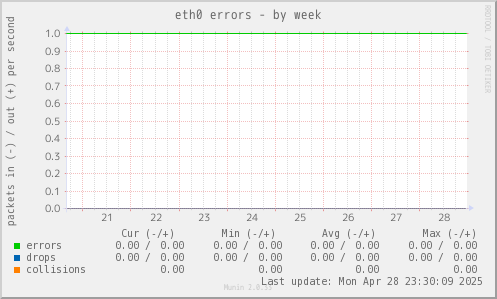
| eth0 errors | |
|
|
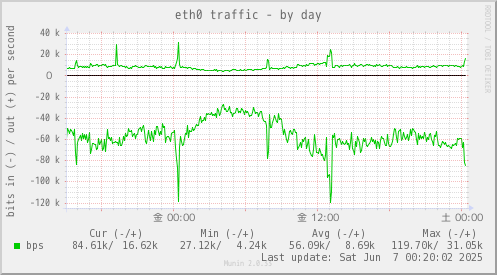
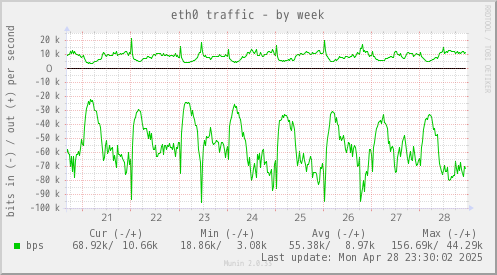
| eth0 traffic | |
|
|
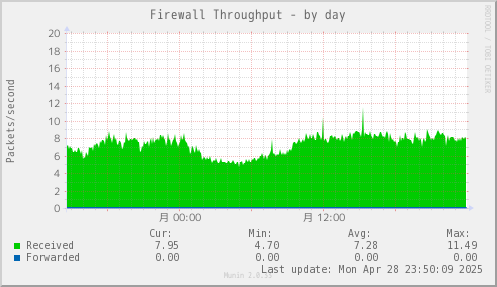
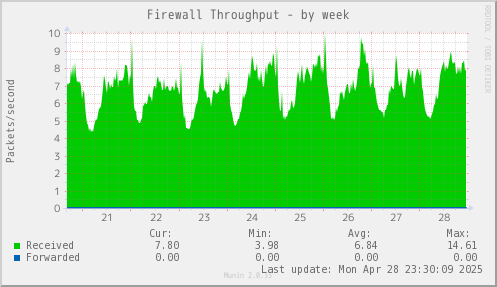
| Firewall Throughput | |
|
|
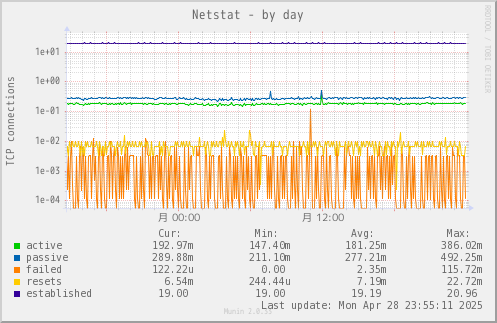
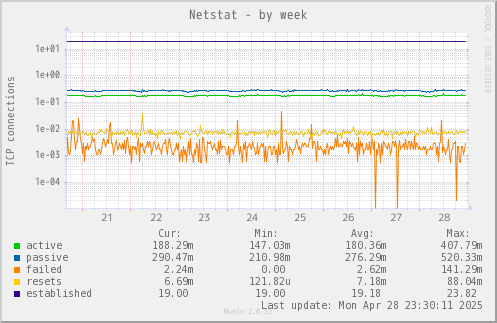
| Netstat | |
|
|
nginx
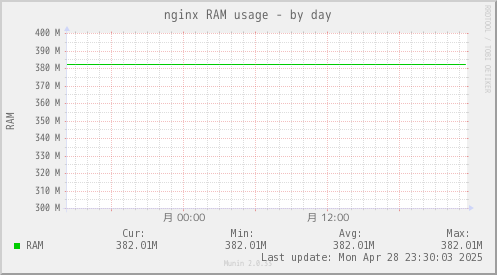
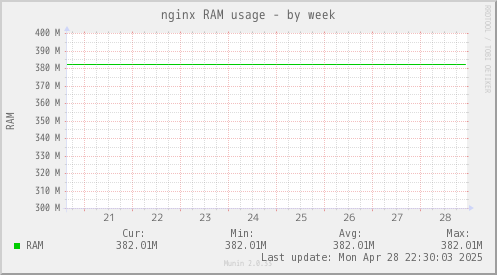
| nginx RAM usage | |
|
|
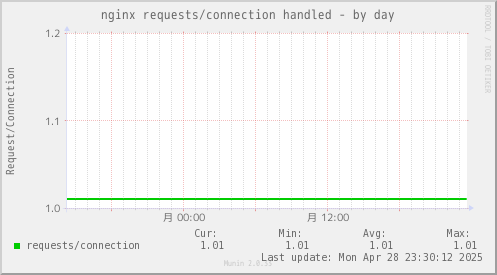
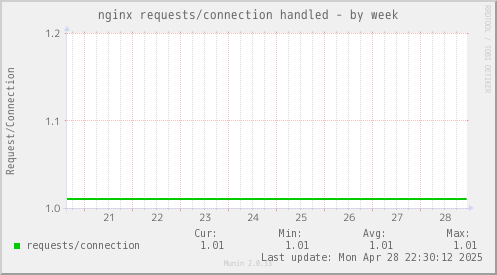
| nginx requests/connection handled | |
|
|
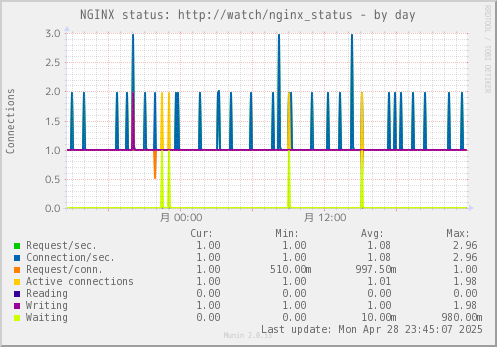
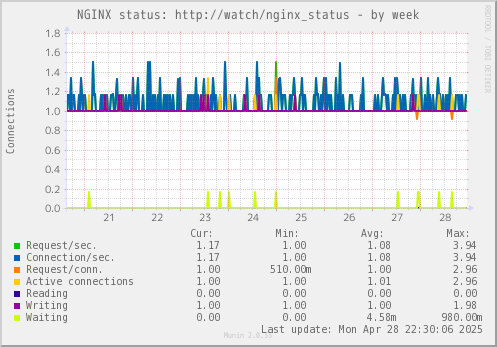
| NGINX status: http://watch/nginx_status | |
|
|
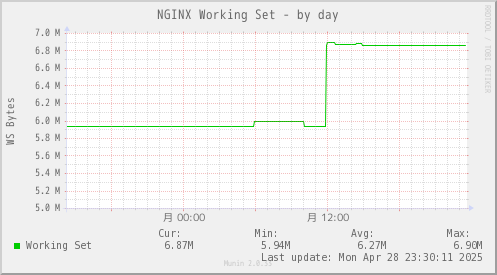
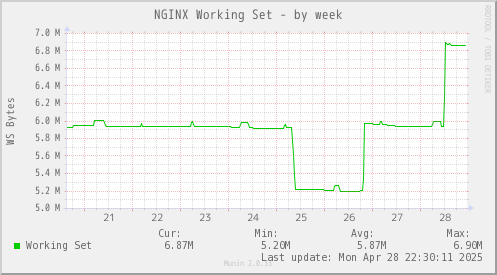
| NGINX Working Set | |
|
|
postfix
| Postfix bytes throughput | |
|
|
| Postfix Mailqueue | |
|
|
processes
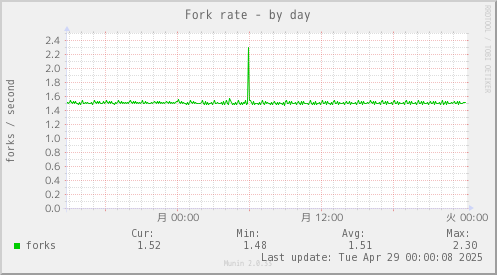
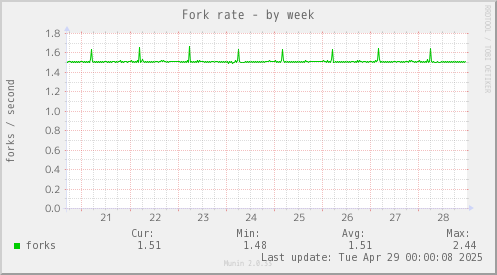
| Fork rate | |
|
|
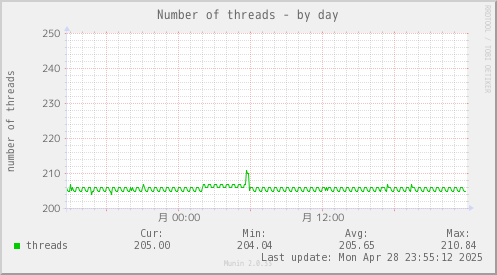
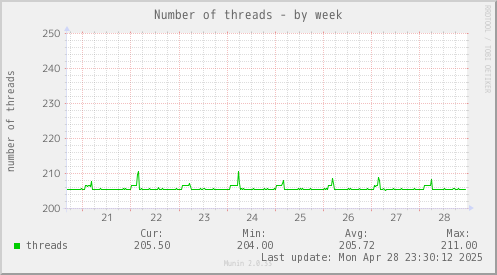
| Number of threads | |
|
|
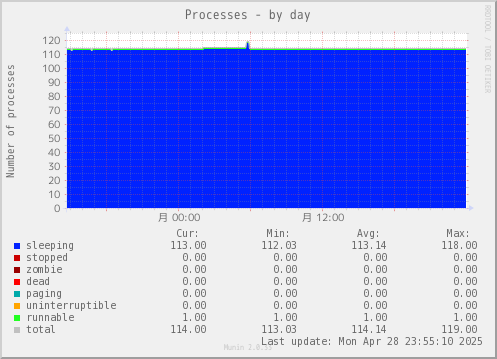
| Processes | |
|

|
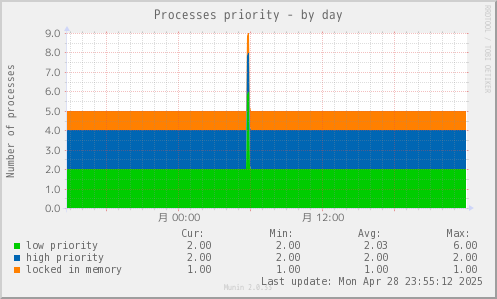
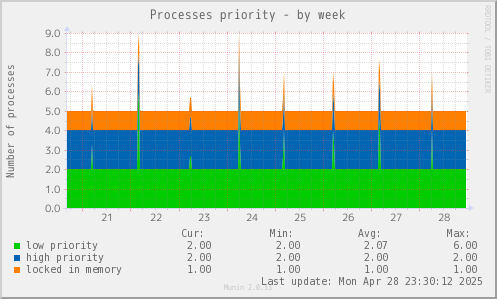
| Processes priority | |
|
|
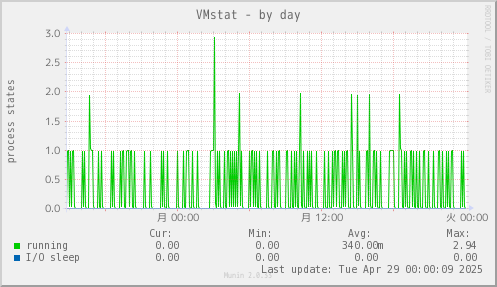
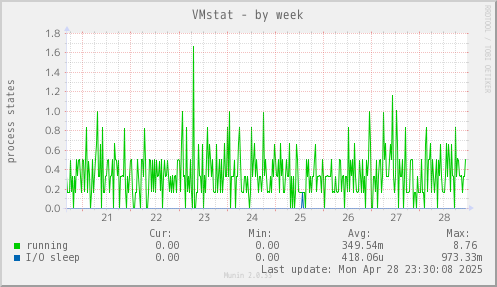
| VMstat | |
|
|
system
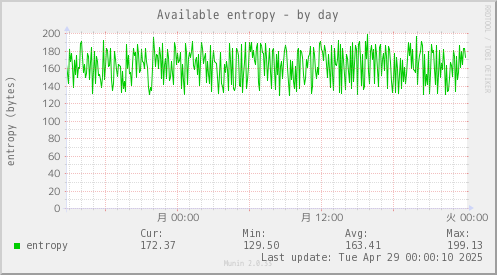
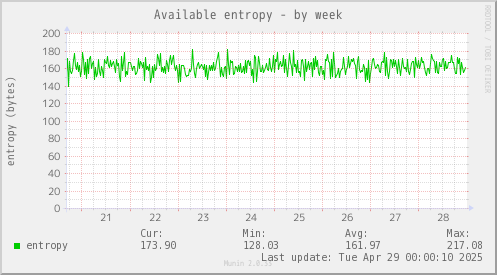
| Available entropy | |
|
|
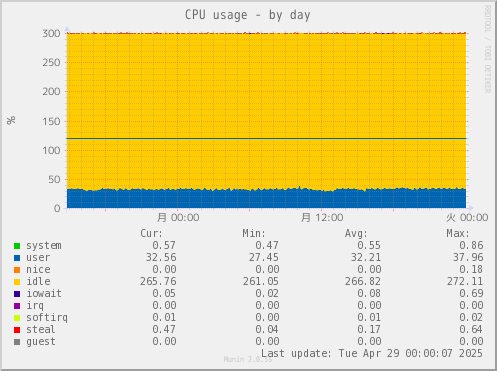
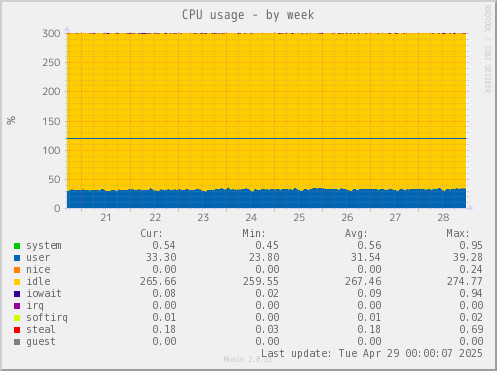
| CPU usage | |
|
|
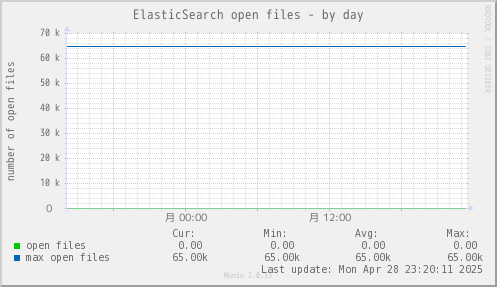
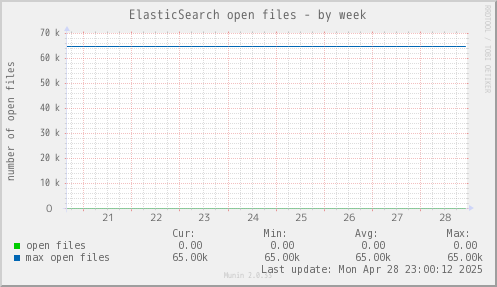
| ElasticSearch open files | |
|
|
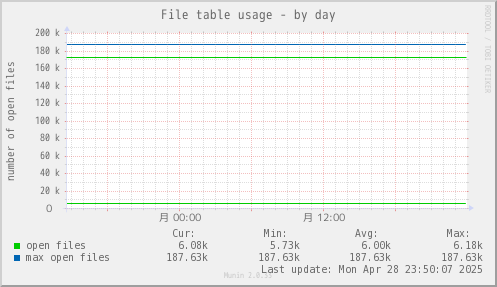
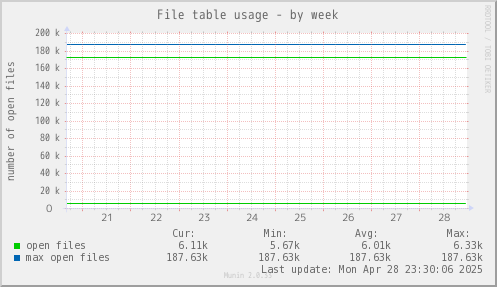
| File table usage | |
|
|
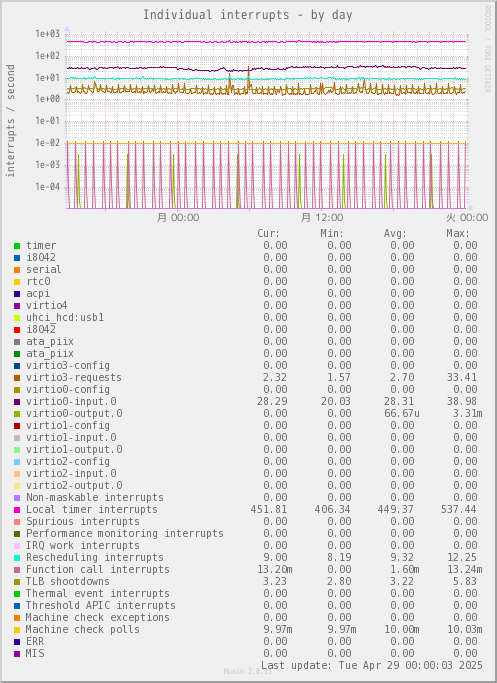
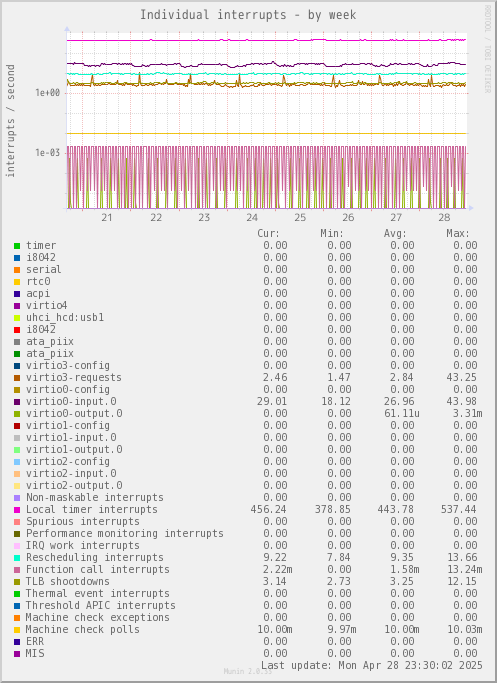
| Individual interrupts | |
|
|
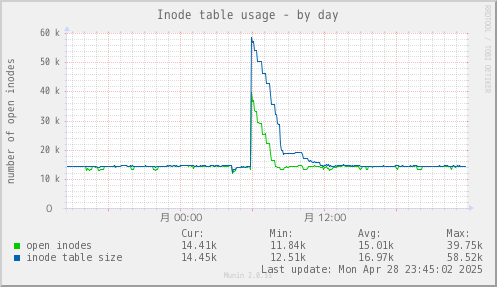
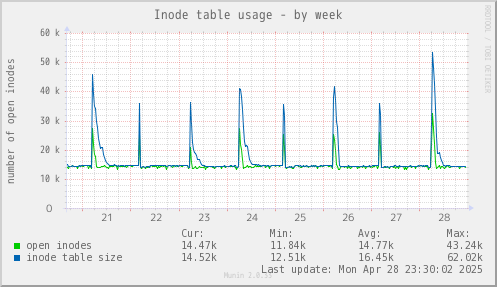
| Inode table usage | |
|
|
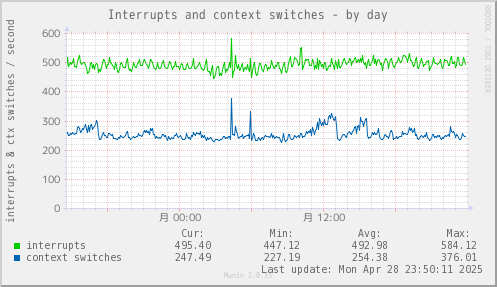
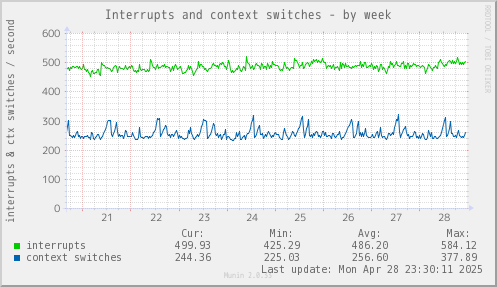
| Interrupts and context switches | |
|
|
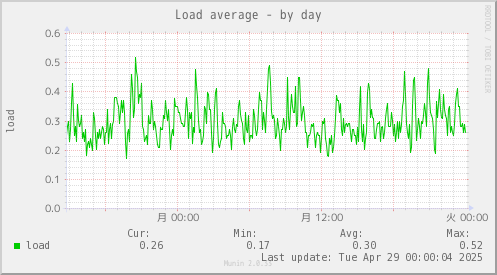
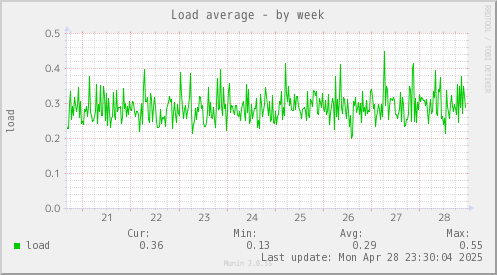
| Load average | |
|
|
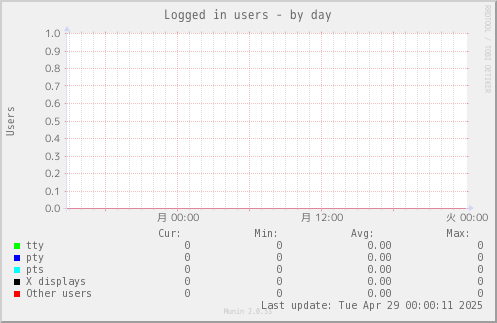
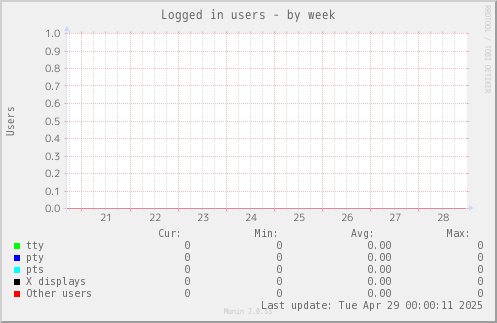
| Logged in users | |
|
|
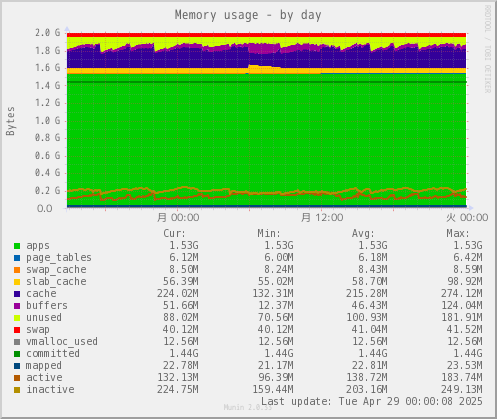
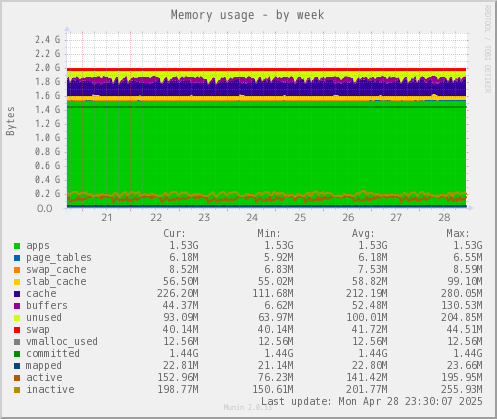
| Memory usage | |
|
|
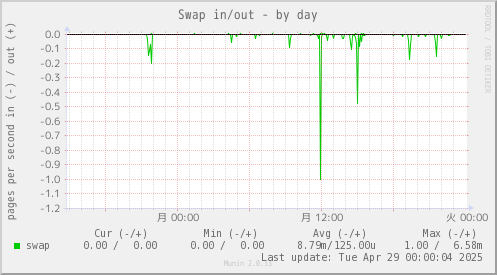
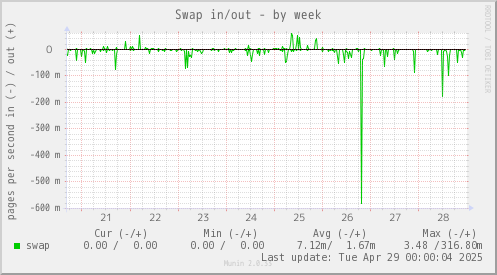
| Swap in/out | |
|
|
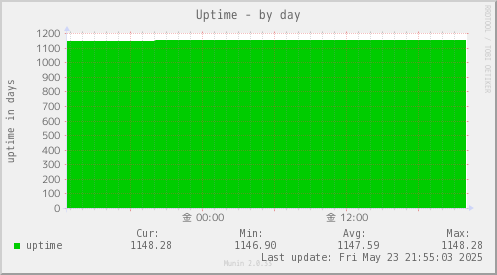
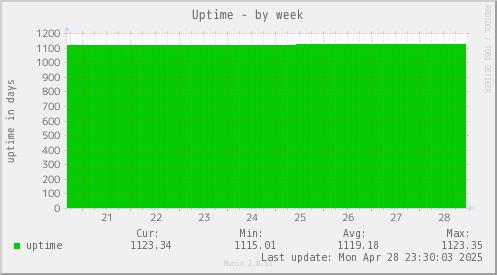
| Uptime | |
|
|
time
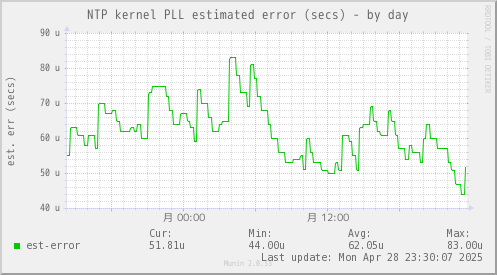
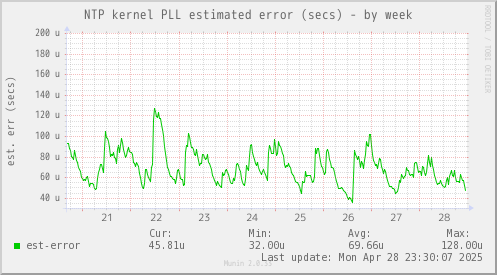
| NTP kernel PLL estimated error (secs) | |
|
|
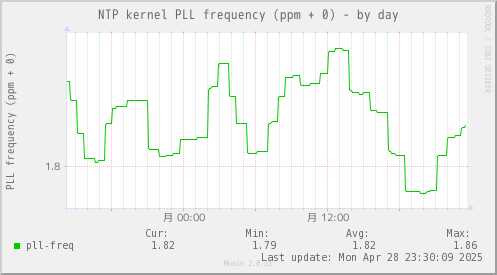
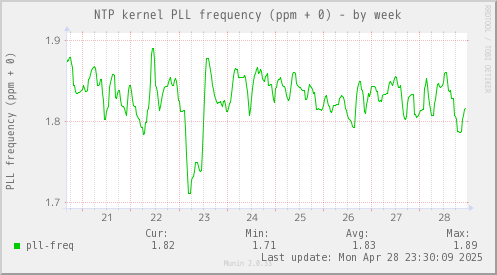
| NTP kernel PLL frequency (ppm + 0) | |
|
|
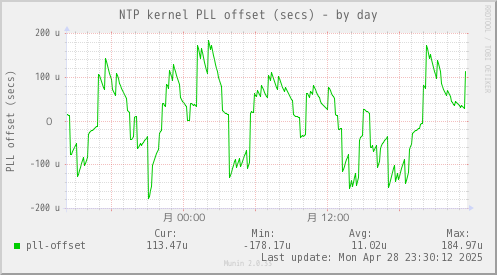
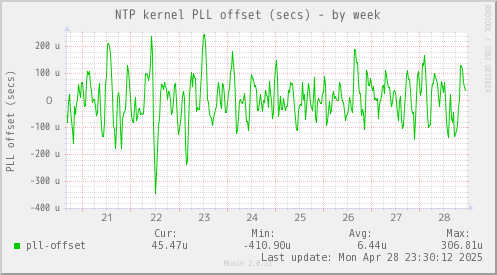
| NTP kernel PLL offset (secs) | |
|
|
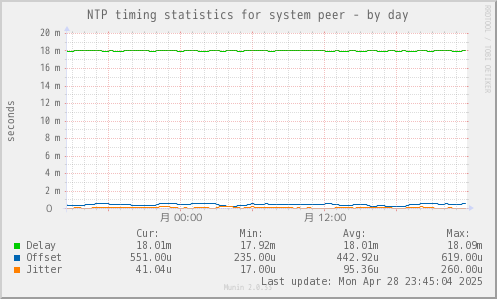
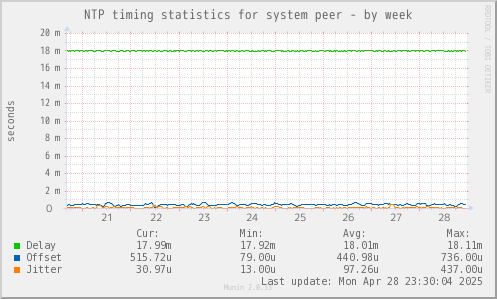
| NTP timing statistics for system peer | |
|
|